The White River Report Card
The White River Report Card is an assessment and communication tool to measure community progress, align partners and activities, and inspire change that improves our river and its watershed while preserving the community and economy.
The White River Report Card
Watershed report cards are assessment and communication tools that have been used around the world to compare ecological, social, and/or economic information against predefined goals or objectives. Similar to school report cards, watershed report cards provide performance-driven numeric and letter grades to effectively integrate and synthesize large, often complex, information into simple scores that can be communicated to decision-makers and the general public to help guide community activity and public policies.
Report Card Development
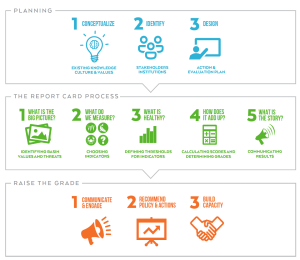
 This first White River Report Card was created by following an extensive co-development process (diagrammed here) which involved over 200 stakeholders from the community, business, industry, government, agricultural, conservation, and utility sectors. The key to a report card’s success is the use of measures called indicators that reflect the many different community values and uses of the river and its watershed.
Learn more about the Report Card by clicking the button below.
Learn More
White River Grades
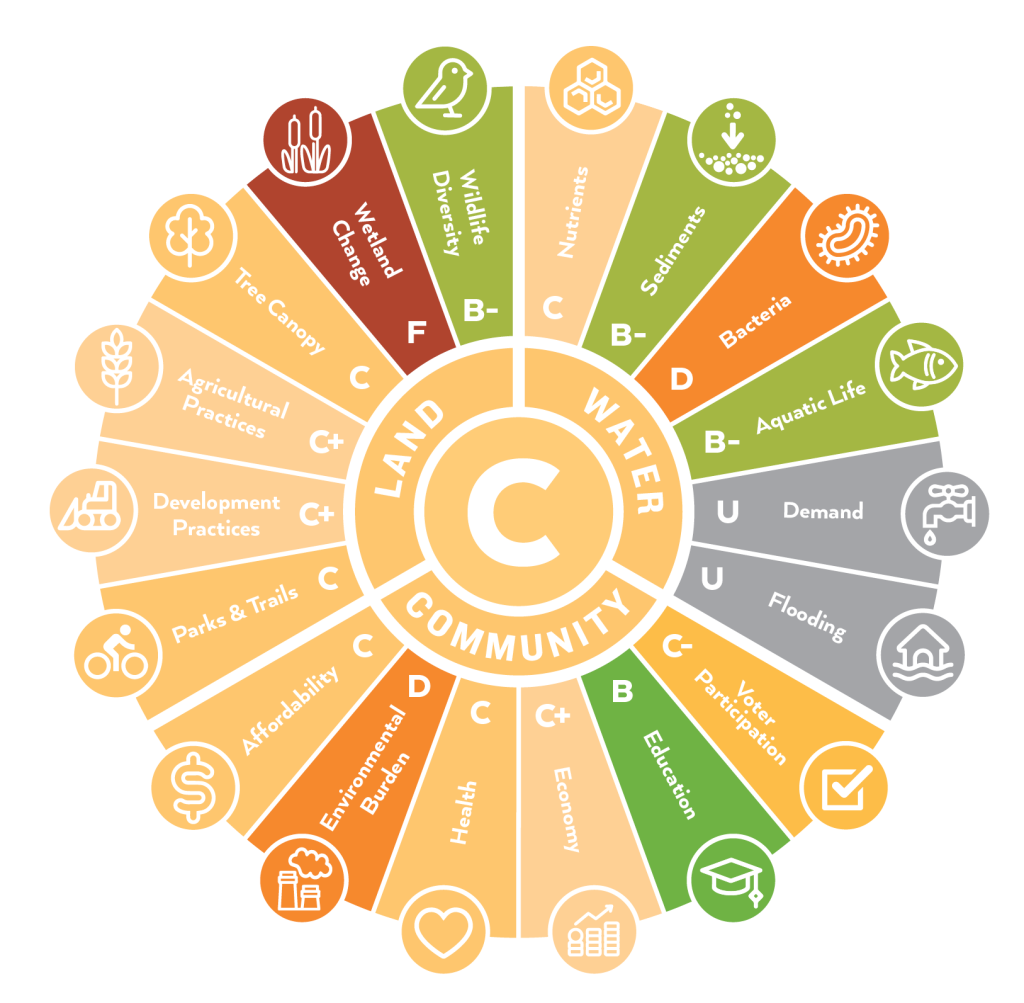
Overall, the White River watershed has a moderate health score of 51%, known as a “C” in the language of a report card. This grade is a composite of three broad indicator categories: COMMUNITY, LAND, and WATER, which are each made up of six indicators that provide grades at a more detailed level. They are illustrated in the pinwheel shown below.

Community
The overall Community score is 51%, a C. The highest scoring indicator is Education with a B (71%) due to good high school graduation (or equivalent) rates in the region. The lowest scoring Community indicator is Environmental Burden with a D (29%), which is due to the high potential of exposure to contaminants like air and/or water pollution, hazardous sites, and lead.
Land
The overall Land score is 47%, a C. The highest scoring indicator is Wildlife Diversity with a B- (61%) due to key indicator species being found throughout the watershed. The lowest grade is Wetland Change, which scores an F (7%) due to extensive historic and ongoing wetland loss throughout the watershed.
Water
The overall Water score is 54%, a C. The highest scoring indicator is Aquatic Life with a B- (64%) due to good aquatic habitat and fish communities. The lowest-scoring indicator is Bacteria with a D (33%) due to how often waterway bacteria levels are unsafe for swimming.
These indicators have also been evaluated individually within nine regions of the White River watershed. This was done to identify unique conditions in various parts of the watershed so that strategic and targeted actions could be taken for improvement.
Explore White River Report Card Grades by clicking the button below.
Explore the Grades
Next Steps, Raise the Grade!
The creation of the White River Report Card is just the beginning. The report card provides a baseline understanding of community and ecosystem conditions. It will be used to broadly communicate important thresholds, increase public awareness, and inform decision-makers to promote collective work to improve the health of the watershed. The report card will be used to engage and align partners and activities around report card indicators to increase collaboration, capacity, efficiency, and improve scores. Additionally, the multidisciplinary stakeholders that created the report card will continue to work together to develop policy language, model local ordinances, and other strategies to improve future report card scores.
Learn more about improvement strategies here.
Improvement Strategies

Programs
- River Assessment Field Team (RAFT)
- Monthly Sampling Events
- RAFT Habitat Evaluation Event – March 22
- RAFT Monthly Sampling Event – March
- RAFT Sampling Event – April
- RAFT Monthly Sampling Event – May
- RAFT Monthly Sampling Event – June
- RAFT Sampling Event – July
- RAFT Monthly Sampling Event – August
- RAFT Monthly Sampling Event – September
- RAFT Sampling Event – October
- RAFT Monthly Sampling Event – November
- RAFT Monthly Sampling Event – December
- RAFT Volunteer & Training Program
- RAFT Corporate Events
- River Assessment Field Team (RAFT) Volunteer Registration
- RAFT Online Training
- RAFT Sampling Data
- Monthly Sampling Events
- White River Art Canoes
- Local Clean Water Campaigns
- Science & Policy Forums
- The White River Report Card
- White River Clean-Up
- White River Paddle Days and Festival
- Stormwater Landscape Maintenance Training
- Indiana Water Summit
- The Collective Tap Podcast
- Clear Choices Clean Water
- StormWater Action Teams (SWAT)
- Trained Individual Contractor Certification
- State of the Waters
- Regional Stormwater MS4 Program